
System Architecture Diagram Maker
Add parts to the canvas, drop them into zones, connect them, or describe the system in plain text and let the layout follow.
Free · runs in your browser · nothing is uploaded
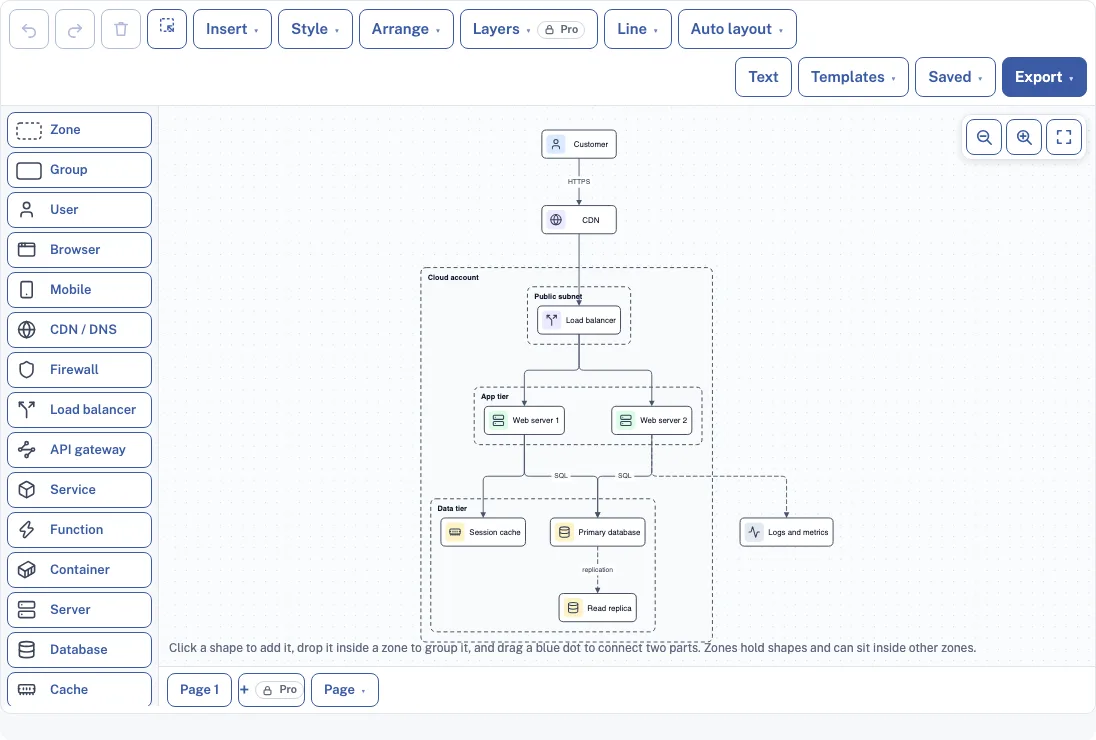
How to use the System Architecture Diagram Maker
- Open Templates and choose a starter close to your design, or start on a blank canvas.
- Click a shape in the column beside the canvas (a strip on phones) to add it, then drag it into place. Use Zone for a dashed box and Group for a solid box.
- Drop a shape inside a zone and it belongs to that zone. Drag it out and it leaves.
- Connect two shapes by dragging a blue dot from one to the other, then double-click the connection to label it.
- Open the Line menu to make a connection dashed, which suits async calls. Use the Style menu for colors, widths and arrowheads.
- Click the Text button to write the diagram as lines of text. The drawing updates as you type.
- Open the Auto layout menu to arrange everything top to bottom or left to right. Zones stay together.
- Open the Export menu to save a PNG, SVG or PDF. Open the Saved menu and choose Copy link to this diagram to share it.
Auto layout is the quickest fix when a diagram grows messy, and undo brings the old positions back. Each page holds up to 400 shapes.
What is a system architecture diagram?
A system architecture diagram is a map of how the parts of a software or cloud system fit together. It shows the components, where data is kept and the links between them, at a high level rather than in code detail. Teams use one to explain a design, plan a change or review security.
What should a system architecture diagram include?
Include every component a reader needs to follow a request, the boundaries between accounts or networks, and the direction and type of each connection. Label what each link carries and leave out detail the reader does not need. Nested zones are what make the boundaries readable: an account holds a network, a network holds a subnet, and the shapes inside stay inside when you move any of them.
How do I draw a cloud architecture diagram?
Start with the outer boundary, such as your cloud account or region, as a Zone, then place the networks and services inside it and draw arrows for the traffic between them. Work from the outside in, so each shape lands in the zone it belongs to.
- Pick the starter closest to your design, such as three-tier web app or serverless API, from Templates.
- Add a Zone for the account or region. Add a Zone inside it for each network or subnet.
- Place entry points (User, Browser, CDN/DNS, Firewall, Load balancer) at the edge of the outer zone.
- Put Service, Function, Container or Server shapes inside the matching subnet zone.
- Add Database, Cache, Queue or Storage shapes where your data lives.
- Connect the shapes with blue-dot drags. Use the Line menu for dashed async links and label each one.
- Add Auth and Monitoring shapes, then run Auto layout and adjust.
The shapes are generic, so the same diagram works for any cloud provider.
What are the types of architecture diagrams?
Architecture diagrams usually show a few kinds of information: who uses the system, which components do the work, where data is kept, and how the parts connect and are protected. This tool groups its shapes into the same families.
| Family | Shapes in the tool | Use it to show |
|---|---|---|
| Users and clients | User, Browser, Mobile, External | who or what calls the system |
| Network edge | CDN/DNS, Firewall, Load balancer, API gateway | how traffic enters |
| Compute | Service, Function, Container, Server | what runs the logic |
| Data | Database, Cache, Queue, Storage | where data lives and moves |
| Structure and operations | Zone, Group, Auth, Monitoring | boundaries, security and observability |
Frequently asked questions
Can I use official cloud provider icons?
No. The tool bundles no vendor logos, because cloud providers’ icon terms limit how those icons may be shared. Its shapes are generic, so one diagram works for any provider.
Can I add my own shapes or icons?
Yes. Use Insert to add a picture from a file, or search the built-in library of about 2,000 line icons. They sit alongside the standard shapes.
Can I write the diagram as text?
Yes. Click the Text button and write one part per line: “type: Name” for a shape, “zone: Name {” with a closing “}” for a zone, and “A -> B : label” for a connection. Drawing and text stay in step, and omitted types are guessed from the name, so “Orders DB” becomes a database.
Does it open in diagrams.net?
Yes, with the Pro plan. Pro adds an editable .drawio file that opens in diagrams.net, keeps zones as real containers with the shapes inside them, and keeps connectors attached. The free PNG, SVG and PDF exports do not include that file.
Can I nest zones?
Yes, to any depth, for example an account containing a network and a subnet. A zone grows to keep what it holds, moving a zone moves everything inside it, and deleting a zone keeps its contents.
Related tools
Software & Network Diagrams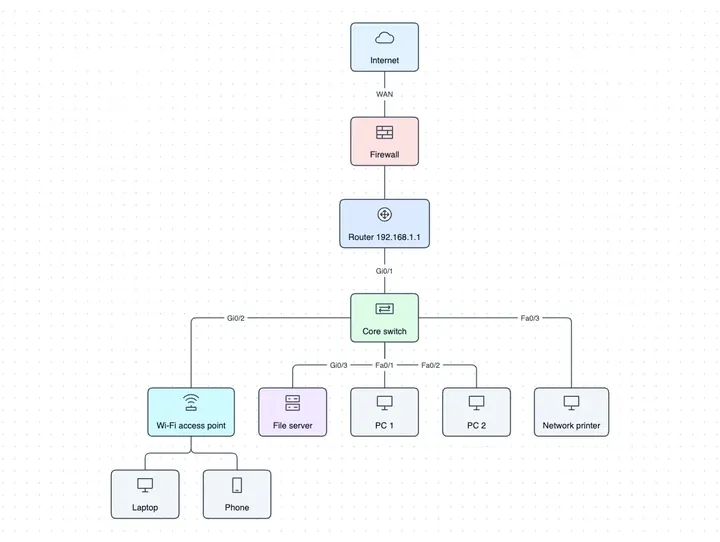
Network Diagram Maker
use it for routers, switches and the physical links between them.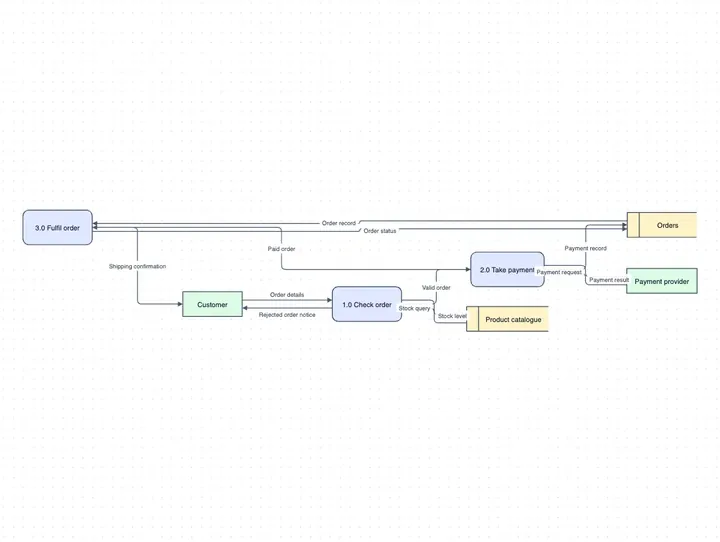
Data Flow Diagram Maker
use it to show how data moves between processes and stores.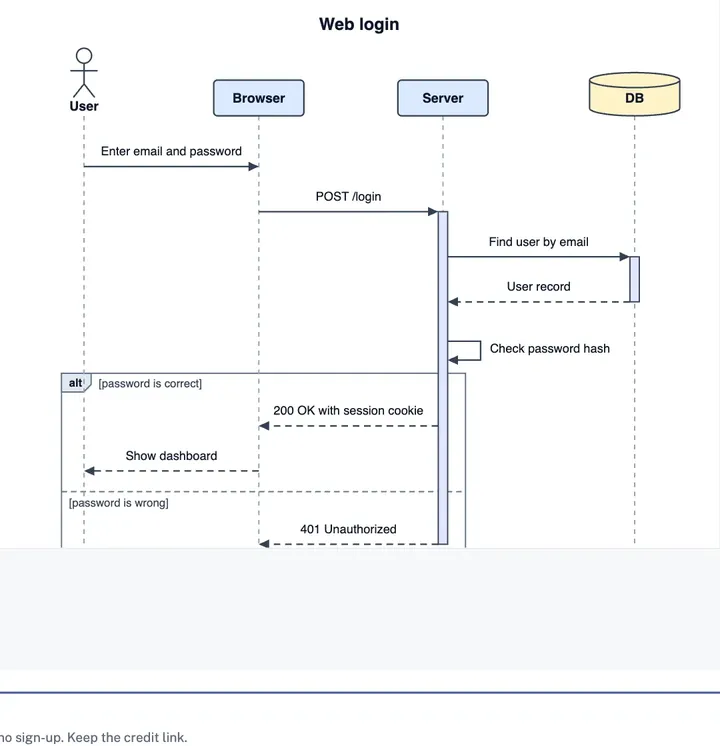
Sequence Diagram Maker
use it for the order of calls in one request.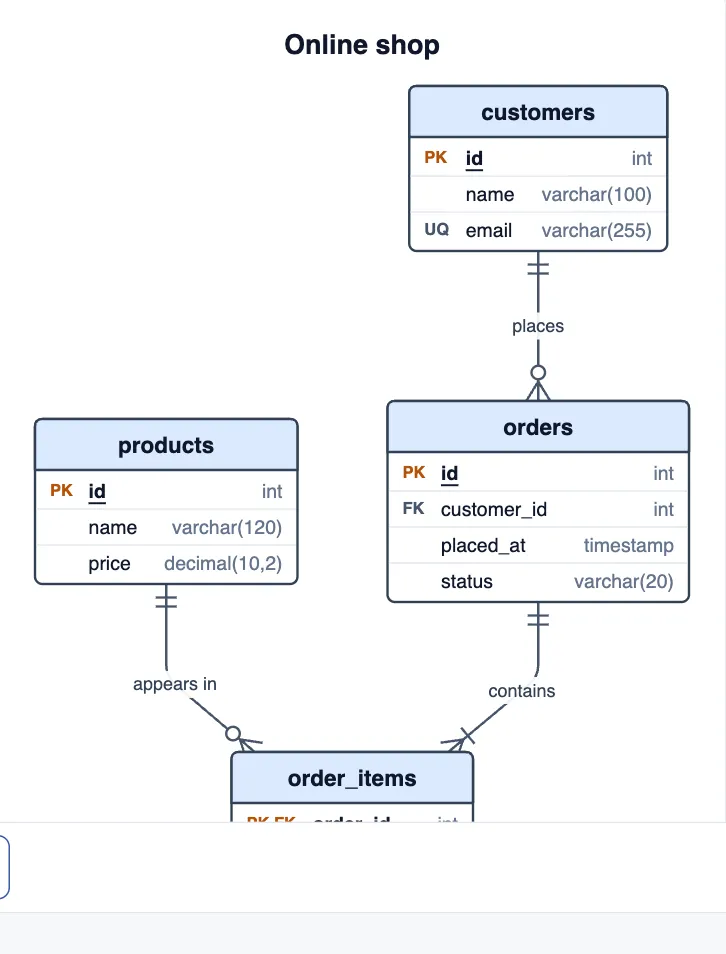
ER Diagram Maker
use it to design the tables behind a database shape.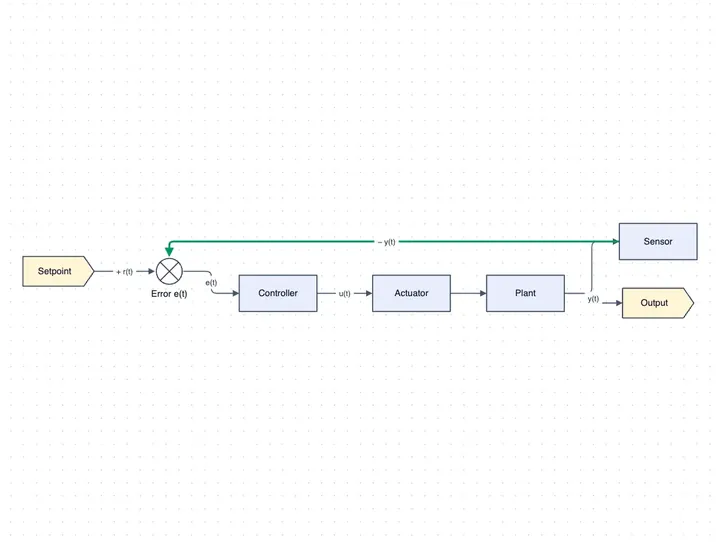
Block Diagram Maker
use it for signal paths between functional blocks.
Wireframe Maker
use it to sketch the screens of the system.