
SQL to ER Diagram
Free, no sign-up, nothing uploaded: paste CREATE TABLE statements and your browser reads them and draws the tables, keys and relationships.
Free · runs in your browser · nothing is uploaded
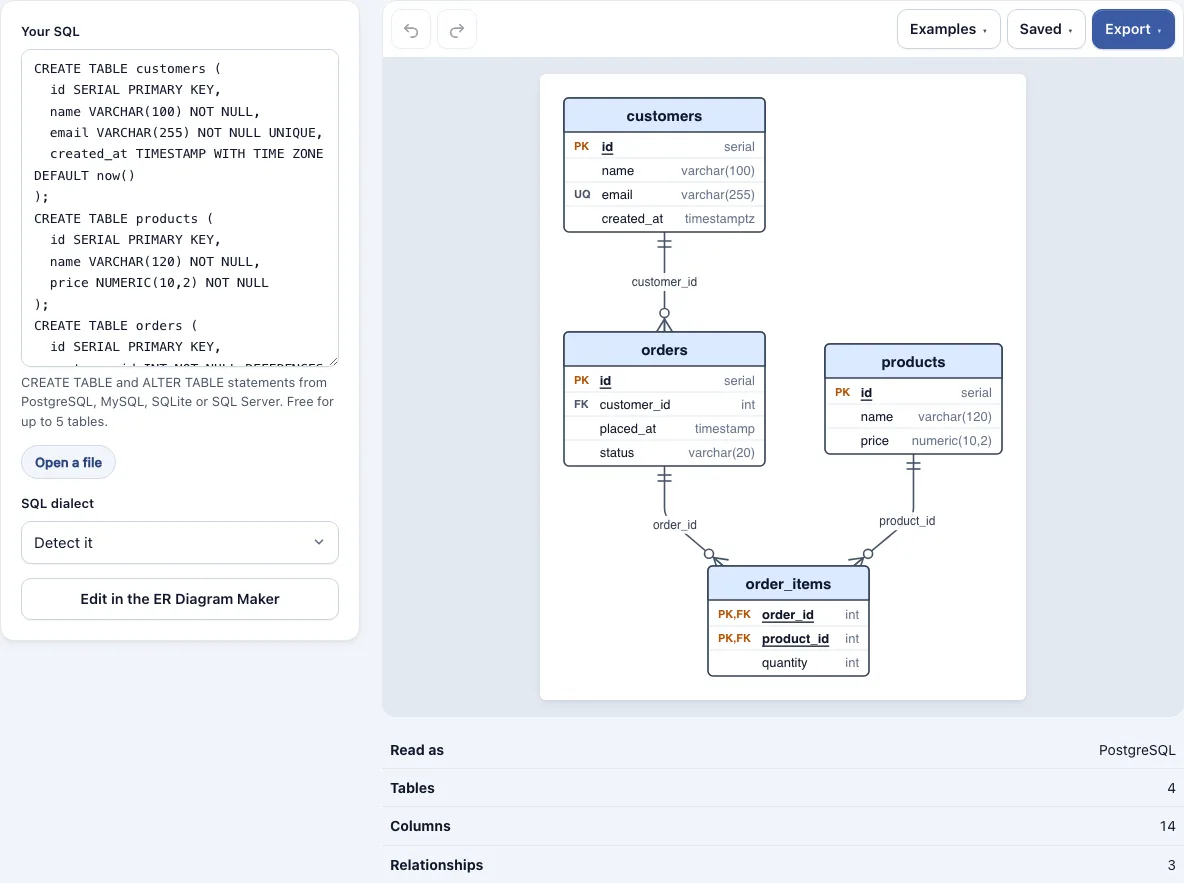
How to use the SQL to ER Diagram tool
- Paste your SQL into the input box, or open a .sql, .ddl or .txt file. A full schema dump works, because statements other than CREATE TABLE and ALTER TABLE are skipped.
- Check the dialect. The tool detects PostgreSQL, MySQL, SQLite or SQL Server from your text. If the detection is wrong, choose the dialect yourself.
- Read the diagram. Each table appears as an entity box, and each foreign key becomes a crow’s foot relationship line.
- Compare the numbers under the diagram for tables, columns and relationships with your schema. A mismatch tells you a table or key was not read.
- If a note appears, read which table or statement it names. Only what it names is left out or needs a check, and the other tables are still drawn.
- Click Edit in the ER Diagram Maker to open the diagram there and make changes. Editing there is free.
- Export the result as PNG at 1x, 2x or 4x, as SVG, or as a picture PDF. Free exports carry no watermark.
Work autosaves in this browser, and the Saved menu keeps named copies of each version. To share, use a share link, which holds the whole document inside the link. Pro adds larger schemas, up to 40 tables in one diagram, and a .drawio export with real table shapes and relationship lines. The first 400,000 characters of a script are read, and a note says so if there are more.
How does an SQL schema become an ER diagram?
Each CREATE TABLE statement becomes one entity box, and the constraints in it, or in ALTER TABLE statements, become the key markers and relationship lines. The tool reads these declarations directly, so the diagram shows what your database defines, not what someone remembers about it.
| SQL element | How it appears in the diagram |
|---|---|
| CREATE TABLE | One entity with its columns |
| PRIMARY KEY (inline or in ALTER TABLE … ADD) | Read as the primary key of that table |
| UNIQUE column | Read as a unique column |
| FOREIGN KEY (inline or in ALTER TABLE … ADD) | Crow’s foot relationship line between the two tables |
Each statement is parsed on its own. A table the parser cannot read, for example one with a schema-qualified type, goes to a simpler reader that takes its columns and keys, and a note says which tables. A statement that still cannot be read produces a note, and the rest of the schema still appears. A script with no CREATE TABLE gets a message instead of a diagram. Comments, INSERT rows and other statements in a full dump are skipped, so you do not need to clean the file first. If a foreign key points at a table that is not in the script, a note names it and no line is drawn.
Which command exports a schema from my database?
Run mysqldump –no-data for MySQL, pg_dump –schema-only for PostgreSQL, or sqlite3 .schema for SQLite. Each prints the table structure without the row data, which is all the tool needs.
| Database | Command | What it prints |
|---|---|---|
| MySQL | mysqldump –no-data | Table definitions, no rows |
| PostgreSQL | pg_dump –schema-only | Table definitions, no rows |
| SQLite | sqlite3 .schema | CREATE statements for the schema |
SQL Server is not covered by these commands, so paste its CREATE TABLE statements directly.
Add your database name and login to each command as usual. These commands print the structure only, so no customer rows or other data are needed. Keep the output in version control next to your code, and you can draw a fresh diagram each time the schema changes.
What this does not do
- It does not connect to a database. It reads only the text you paste or open, so you export the structure first.
- It draws tables, keys and relationships. Statements other than CREATE TABLE and ALTER TABLE, such as INSERT rows, are skipped.
- It reads PostgreSQL, MySQL, SQLite and SQL Server. Free covers up to 5 tables; Pro draws up to 40 in one diagram, and the first 400,000 characters of a script are read, with a note if there is more.
- A statement it cannot read becomes a note naming it, and that table or key is missing from the diagram.
Frequently asked questions
Is it really free?
The tool is free for schemas of up to 5 tables. Larger schemas need Pro. Results may be used commercially without attribution.
What is an ER diagram?
An entity-relationship diagram shows the things a database stores, such as customers or orders, and how they link together. Lines between the boxes show the relationships, and a crow’s foot marks the “many” end of each link.
Which databases does the tool support?
It supports PostgreSQL, MySQL, SQLite and SQL Server. The dialect is detected from your text, or you can choose it.
What happens to my diagram if I close the tab?
Your work autosaves in this browser, so it is still there when you return. The Saved menu holds named copies if you want to go back to a specific version.
Does my SQL get sent to a server?
No. Nothing connects to a database, and the SQL stays in the browser, which matters when the schema is private.
How do I import a database schema?
You don’t connect to the database. Export the structure with a dump command from the table above, then paste the text or open the file. Only the structure is needed, not the data.
What happens if one statement is invalid?
That statement becomes a note, and the other tables are still drawn. Fix the statement named in the note and paste the script again.
How do you keep a large ER diagram readable?
Group related entities together, use one notation style throughout, and label every relationship with its cardinality. Spreading a big schema across several smaller pastes also keeps each diagram easier to scan.
Related tools
Diagram Converters & File Viewers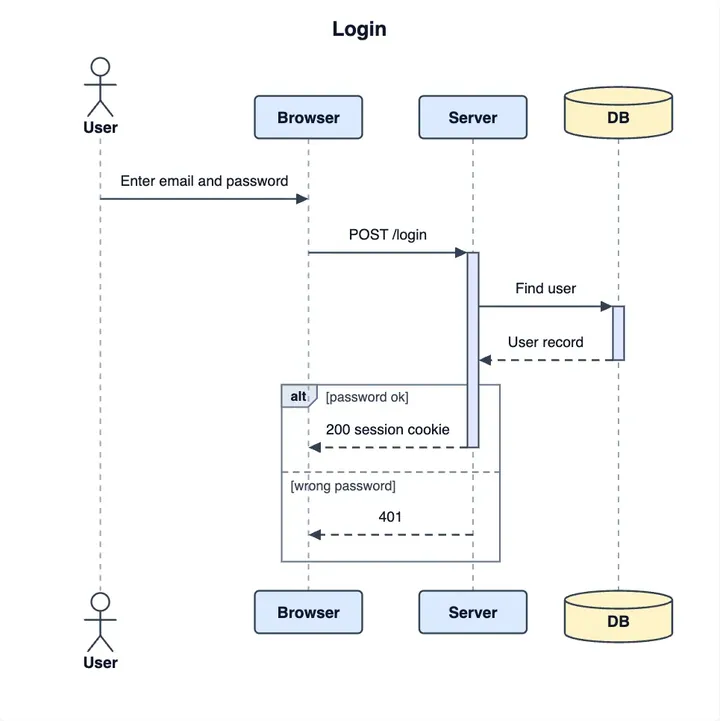
PlantUML Online Editor
write entity diagrams as text.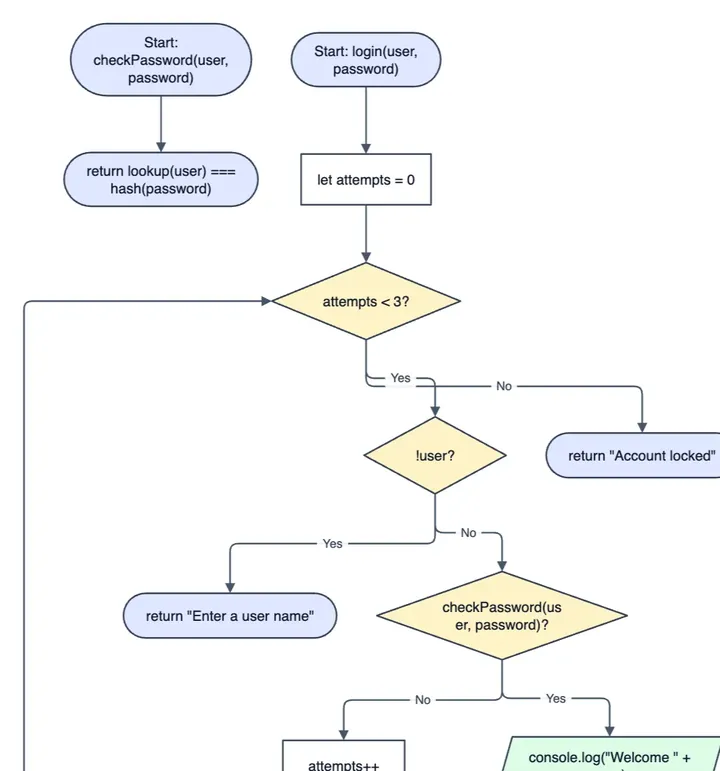
Code to Flowchart
draw the logic that uses this database.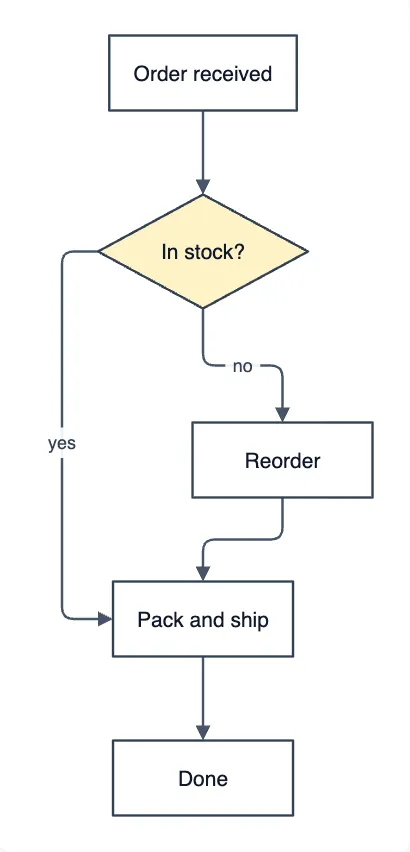
Mermaid to draw.io Converter
use it to move a Mermaid diagram into draw.io.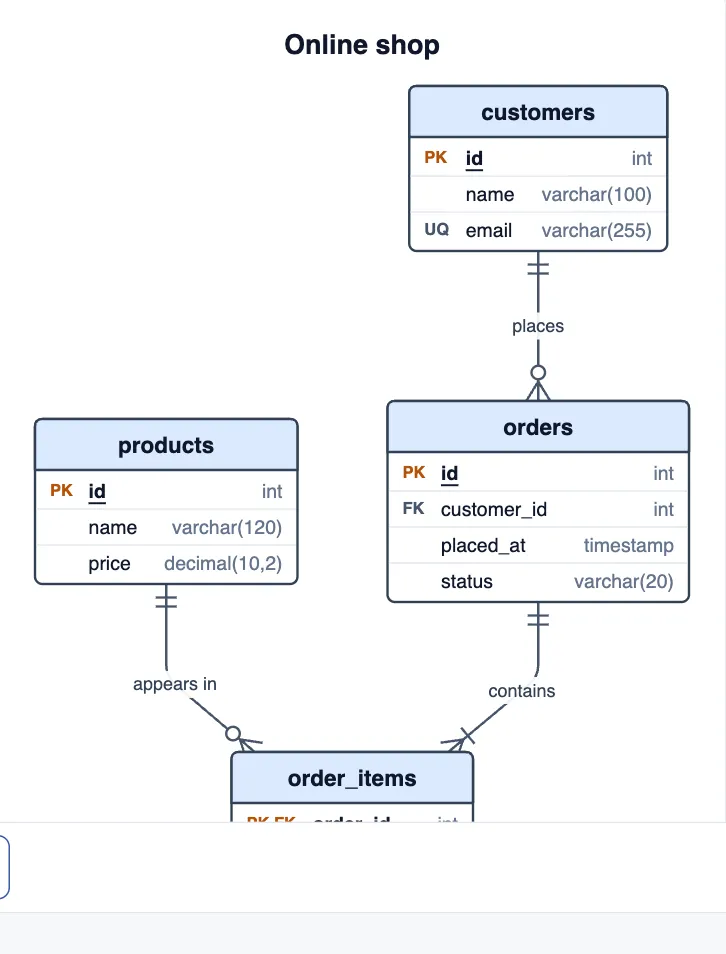
ER Diagram Maker
build or adjust the diagram by hand with its own table language.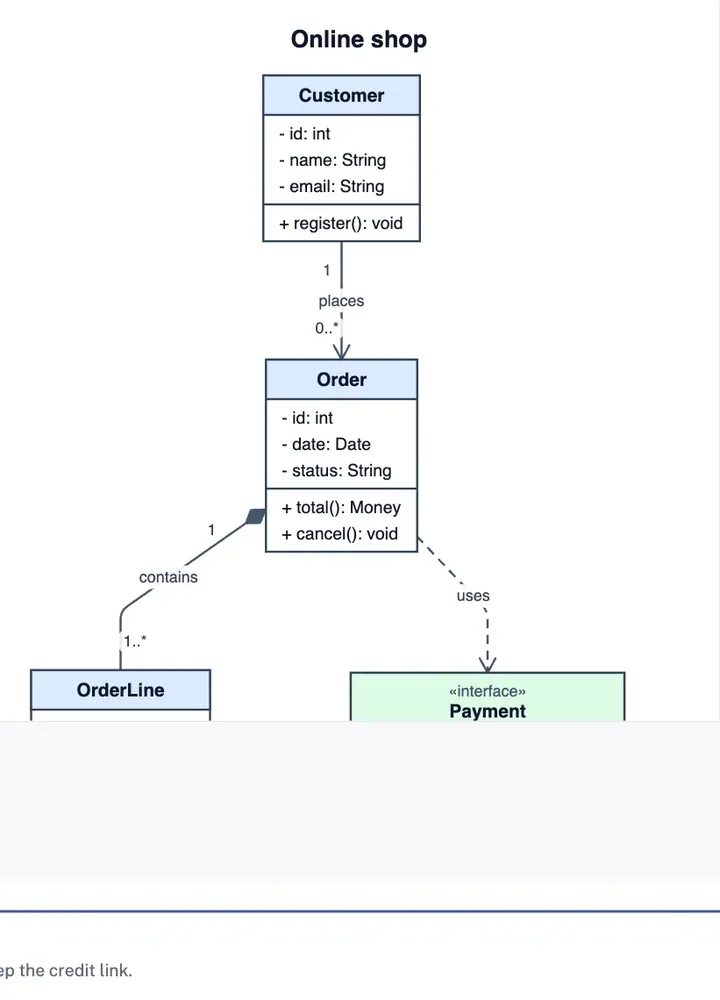
UML Class Diagram Maker
show the classes that sit on top of the tables.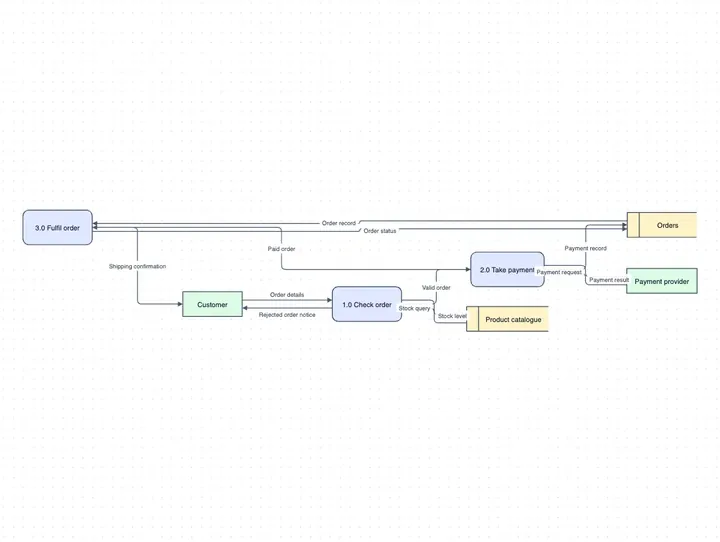
Data Flow Diagram Maker
show how data moves between processes and stores.