
PERT Chart Maker
Free, no sign-up, nothing uploaded: list your activities and what each waits for, and the network draws itself in your browser with earliest and latest times on every box.
Free · runs in your browser · nothing is uploaded
How to use the PERT Chart Maker
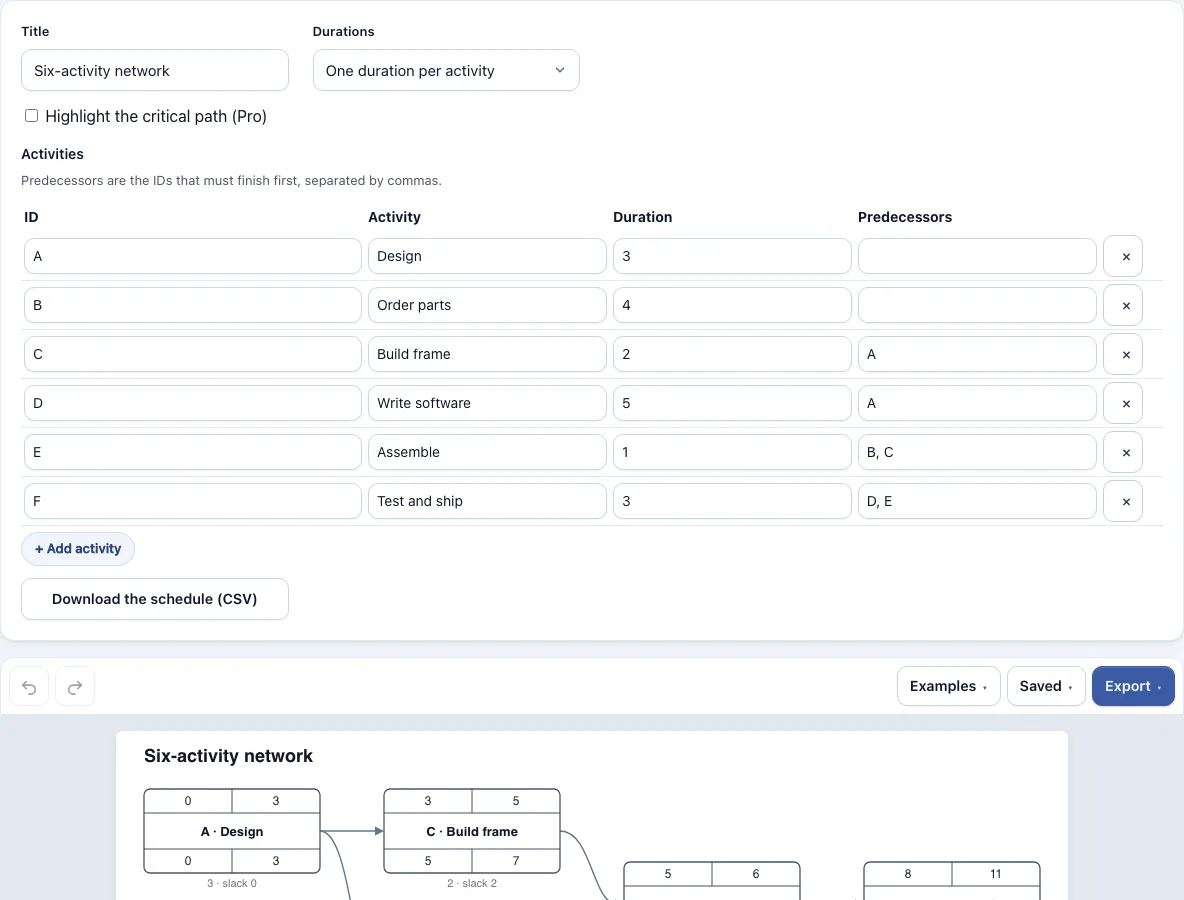
- Pick an example from the list (six-activity network, three-point estimates, product launch or build a house), or choose blank to start from scratch.
- In the activity table, give each activity a unique ID and a name.
- Enter the duration as one number, or as three numbers for optimistic, likely and pessimistic estimates.
- In the predecessors column, list the IDs that must finish first, separated by commas. If D waits for B and C, type B, C.
- Read the diagram. Each box shows earliest start and finish on top, the activity name in the middle, and latest start and finish below.
- If the tool reports a loop, an unknown predecessor, an activity that lists itself or a duplicate ID, fix that row and check the diagram again.
- Export the chart when it looks right, as a PNG at 1x, 2x or 4x, an SVG or a picture PDF, with no watermark. Pro adds the critical path highlight, a vector PDF and a .drawio file that holds the chart as one picture, not as editable shapes.
Your work autosaves in this browser, and the Saved menu keeps named copies so you can try a second plan. The schedule also downloads as CSV. A single chart holds up to 60 activities.
What is a PERT chart?
A PERT chart maps a project as a network: boxes for the activities, arrows for the order they run in, and a time on each. PERT stands for program evaluation and review technique. Each activity is a box, and arrows show which activities must finish before others can start.
This tool draws the chart as an activity-on-node network, with the earliest and latest times written on each box.
How do forward and backward passes find the critical path?
The forward pass sets each activity’s earliest start (ES) and earliest finish (EF). The backward pass sets its latest finish (LF) and latest start (LS). Slack is LS minus ES, and an activity with zero slack is critical.
The rules are simple. Earliest start equals the latest earliest finish of an activity’s predecessors, and earliest finish equals earliest start plus duration. Latest finish equals the earliest latest start of the activity’s successors, and latest start equals latest finish minus duration. The table below uses a four-activity network: A takes 3, B takes 2 after A, C takes 4 after A, and D takes 1 after B and C.
| Activity | Duration | Predecessors | ES | EF | LS | LF | Slack | Critical |
|---|---|---|---|---|---|---|---|---|
| A | 3 | none | 0 | 3 | 0 | 3 | 0 | Yes |
| B | 2 | A | 3 | 5 | 5 | 7 | 2 | No |
| C | 4 | A | 3 | 7 | 3 | 7 | 0 | Yes |
| D | 1 | B, C | 7 | 8 | 7 | 8 | 0 | Yes |
The project takes 8. Activity B has 2 units of slack, so it can slip by 2 without moving the finish date. A, C and D form the critical path.
How is a three-point estimate calculated?
The expected duration is te = (o + 4m + p) / 6, where o is the optimistic time, m the likely time and p the pessimistic time. The variance is ((p - o) / 6)^2. When you enter three numbers in the activity table, the tool uses these formulas for each activity. With o = 2, m = 4 and p = 12, te = (2 + 16 + 12) / 6 = 5, and the variance is (10 / 6)^2, about 2.78.
Frequently asked questions
Is the PERT chart maker free?
Yes. The free version lets you draw the network with its earliest and latest times, and export PNG, SVG and picture PDF files with no watermark. No account is needed, and the work runs in your browser. Results may be used commercially without attribution.
Is there a paid plan?
Yes. The chart, the earliest and latest times, slack and the CSV are free. Pro adds the critical path highlight, the names of every critical path and a network check that flags near-critical, loose and long or uncertain critical activities. It also estimates the chance of finishing by a date and adds a vector PDF and a .drawio file that holds the chart as one picture, not as editable shapes.
Are there templates for PERT charts?
Yes. The examples list includes a six-activity network, a three-point estimates example, a product launch and a build a house example. You can start from any of them, or from a blank chart, and edit the activities.
What is a critical path?
The critical path is the chain of activities with zero slack, so a delay to any of them delays the whole project. In the worked example, the critical path is A, C and D, and the project takes 8 time units.
What does slack mean?
Slack is the amount an activity can slip without delaying the project, calculated as latest start minus earliest start. In the worked example, B has slack 2 because its earliest start is 3 and its latest start is 5.
Is my data uploaded to a server?
No. The tool runs entirely in your browser, and nothing you type or open is uploaded. Your work autosaves in this browser, so it stays on the device you used.
How many activities can one chart hold?
Up to 60 activities fit in one chart. Each activity needs a unique ID, and every predecessor must match an ID that exists in the table.
Why does the tool show an error?
The tool reports four kinds of error: loops, unknown predecessors, an activity that lists itself as a predecessor, and duplicate IDs. Fix the activity table, and the diagram and times update once the network is valid.
Related tools
Timelines, Org Charts & Business Frameworks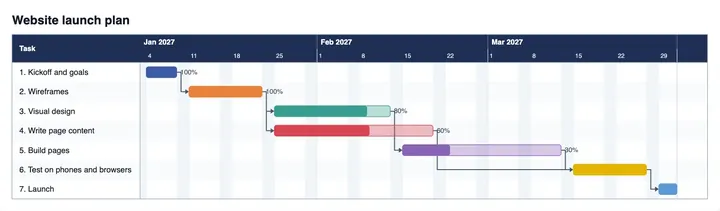
Gantt Chart Maker
use it when you want to see tasks laid out along a calendar timeline.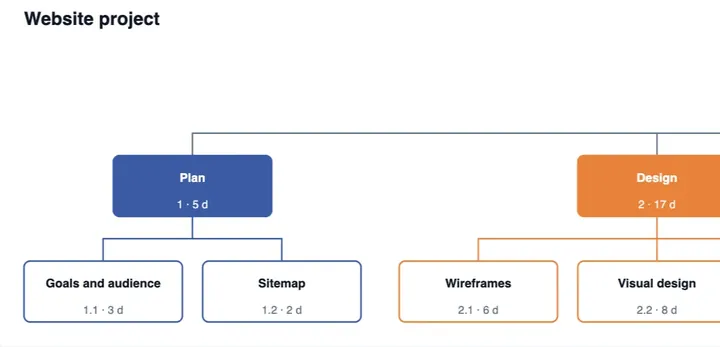
Work Breakdown Structure Template Maker
use it to split a project into smaller deliverables before you list activities.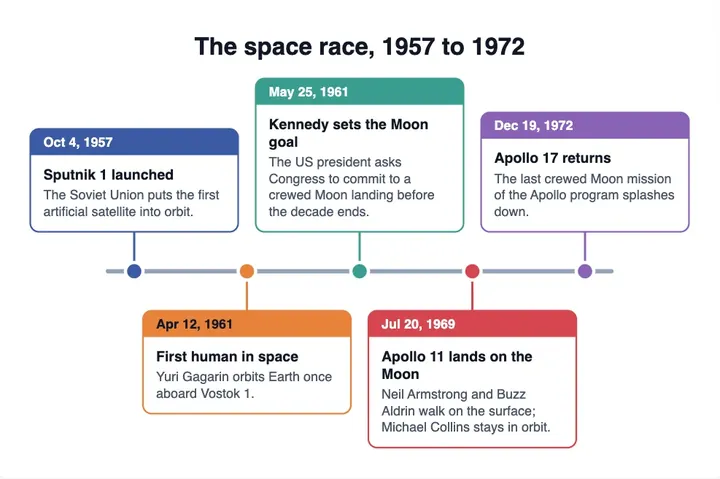
Timeline Maker
use it to show key dates and milestones without the network logic.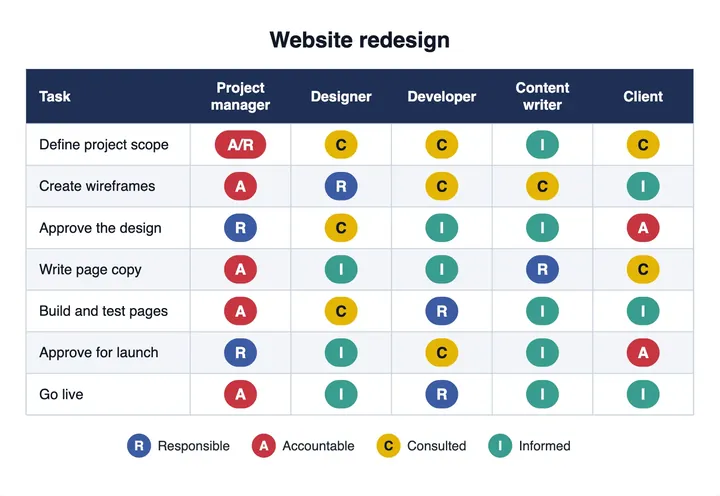
RACI Matrix Maker
use it to decide who is responsible, accountable, consulted and informed for each task.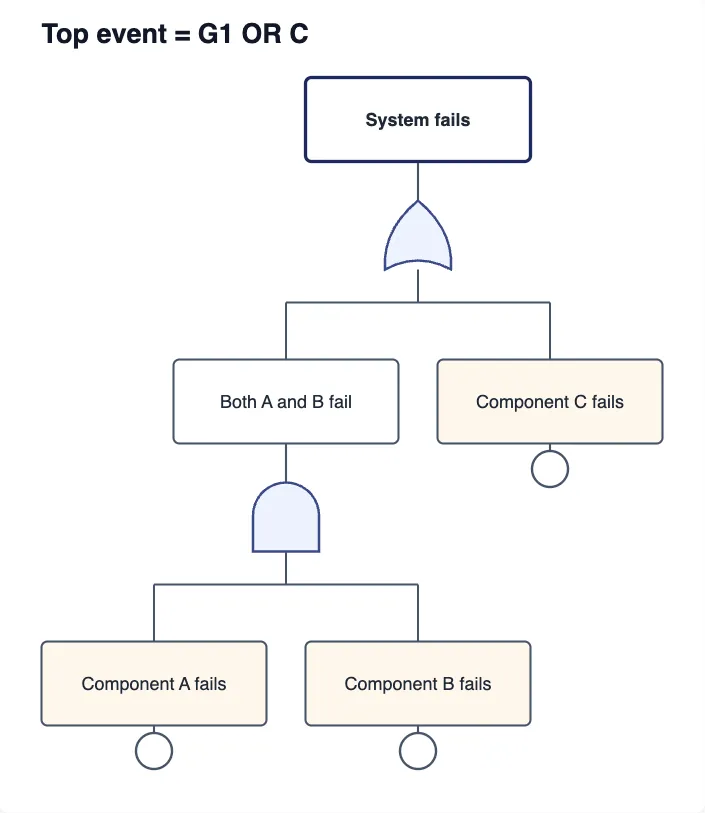
Fault Tree Analysis Maker
use it to map how failures combine to cause a top-level problem.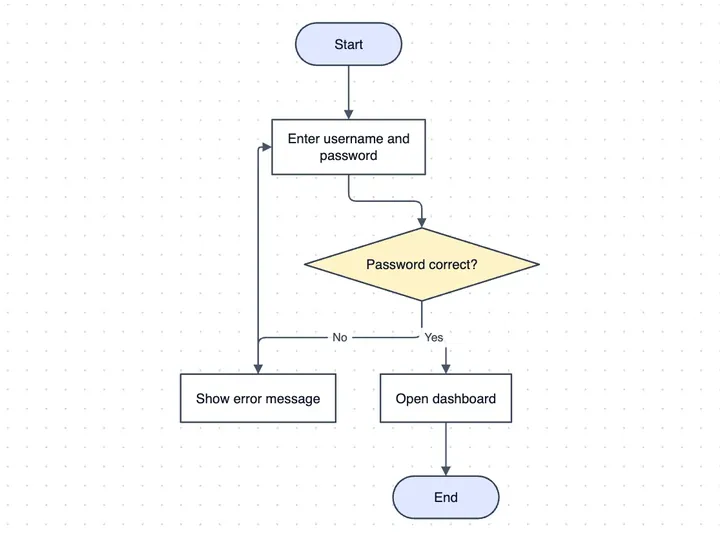
Flowchart Maker
use it to map steps, decisions and processes.