
Org Chart from Excel
Free, no sign-up, nothing uploaded: paste rows from Excel or Google Sheets and your browser draws the org chart, with any problem rows listed by row number.
Free · runs in your browser · nothing is uploaded
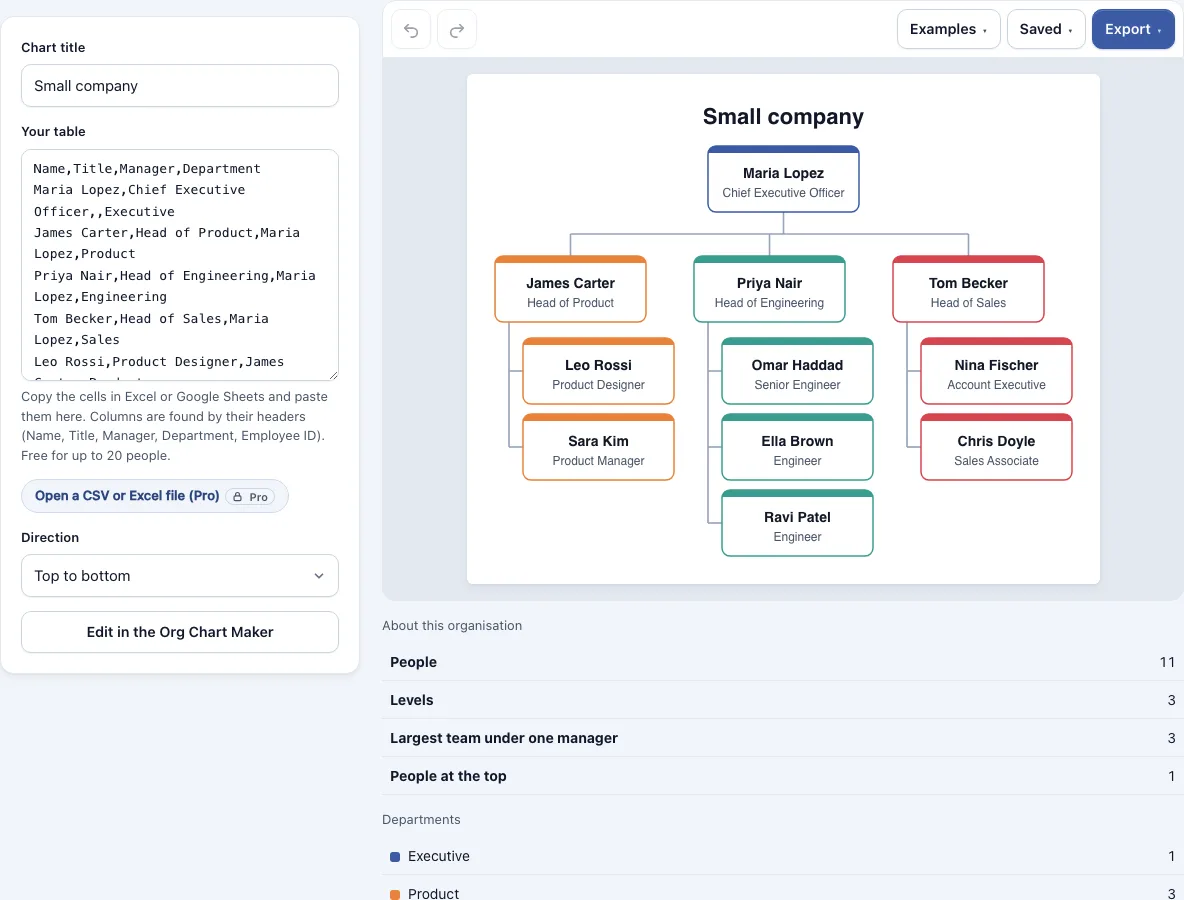
How to use the Org Chart from Excel
- In Excel or Google Sheets, select your table, including the header row, and copy it.
- Click in the paste box on the tool and paste. Tabs, commas, semicolons and pipes are detected automatically.
- Check the column headers. Name, Title, Manager, Department and Employee ID are found by their headers. If you have no headers, the tool assumes the order name, title, manager, department and says so. Title rows above the header row are left out with a note. With Pro, an .xlsx workbook is read from the first sheet that has a Name column, and a note says which sheet that was.
- Read the problem list. Any issues are listed by spreadsheet row, so you can fix them in your sheet and paste again.
- Look at the colours, the department legend and the numbers under the chart. The legend counts people per department, and the numbers show people, levels, the largest team under one manager and the people at the top.
- Choose a direction, either top to bottom or left to right.
- Select Edit in the Org Chart Maker to add people or change their details by hand. That step is free.
- Export as PNG at 1x, 2x or 4x, SVG or picture PDF. Your work autosaves in this browser, and the Saved menu keeps named copies. A share link holds the whole document inside the link itself.
How to generate an org chart from Excel
Each row in your sheet is one person, and the Manager column links that row to someone else’s row. Set up the sheet so every person appears once and every manager name or ID matches a row exactly. Then copy the whole block and paste it into the tool, which builds the reporting lines from those links.
- Put one person on each row.
- Add a header row, for example Name, Title, Manager, Department.
- In the Manager column, type the manager’s name exactly as it appears in the Name column, or use their Employee ID.
- Leave the Manager cell empty for the person at the top.
- Make sure no two people share an ID or an identical name.
- Select the cells, copy them, and paste into the box.
Which column headers does the org chart read?
The tool finds columns by header, so the wording of your headers matters more than their order. Name or Full Name works, or you can use separate First Name and Last Name columns. Title and Job Title are both read, and Manager can also be called Reports To or Supervisor. Department and Team are both accepted, and Employee ID is optional.
| Field | Headers the tool accepts |
|---|---|
| Name | Name, Full Name, or First Name and Last Name |
| Title | Title, Job Title |
| Manager | Manager, Reports To, Supervisor (holds a name or an ID) |
| Department | Department, Team |
| Employee ID | Employee ID |
Which problems does the org chart report, and by which row?
The tool checks the pasted table before drawing the chart and lists each problem by spreadsheet row. These are the cases it reports. A reporting loop is cut at the first person the tool meets in the loop, so check that chain first.
| Problem | What it means |
|---|---|
| Manager not in the table | The Manager value matches no Name or Employee ID |
| Duplicate IDs | Two rows share the same Employee ID |
| Reports to themselves | The Manager value is the person’s own name or ID |
| Same name twice | Two people share an identical name, so links may be ambiguous |
| Reporting loop | A chain of managers leads back to someone already seen |
What this does not do
- It does not read a spreadsheet by itself. You paste rows, and with Pro it opens an .xlsx or .csv file; an .xlsx is read from the first sheet that has a Name column only.
- It does not draw more than 20 people for free. Pro draws up to 150.
- It does not fix your data. Problems such as a manager who is not in the table, a duplicate ID or a reporting loop are listed by row, and a loop is cut at the first person met in it.
- It draws one manager per person, so dotted-line or shared reporting is not shown.
Frequently asked questions
Does Excel have its own org chart tool?
Excel has a SmartArt hierarchy you can use for a chart. You type each box by hand, and it does not read rows from a sheet. This tool reads the rows you already have.
Why use Excel to create a company organization chart?
Your staff list probably already lives in a sheet, so the data is ready to use. Pasting it here builds the chart without retyping each name, and the chart redraws when the table changes.
What is the easiest way to create an organizational chart?
Copy the cells from Excel or Google Sheets and paste them into the box. The chart appears right away, with department colours set automatically.
Can I make an org chart from a CSV file?
Yes. Paste CSV text and the commas are detected. Pro also opens .csv files directly, and the free version takes up to 20 people.
How can I create an organizational chart automatically without a diagramming program?
Paste your table and the chart is built from the manager links in it. You need no drawing software, and the tool runs in your browser.
Is my staff data uploaded anywhere?
No. Nothing you type or open is uploaded to a server, and no account is needed.
Can I use the chart at work?
Yes. Results may be used commercially without attribution.
Related tools
Diagram Converters & File Viewers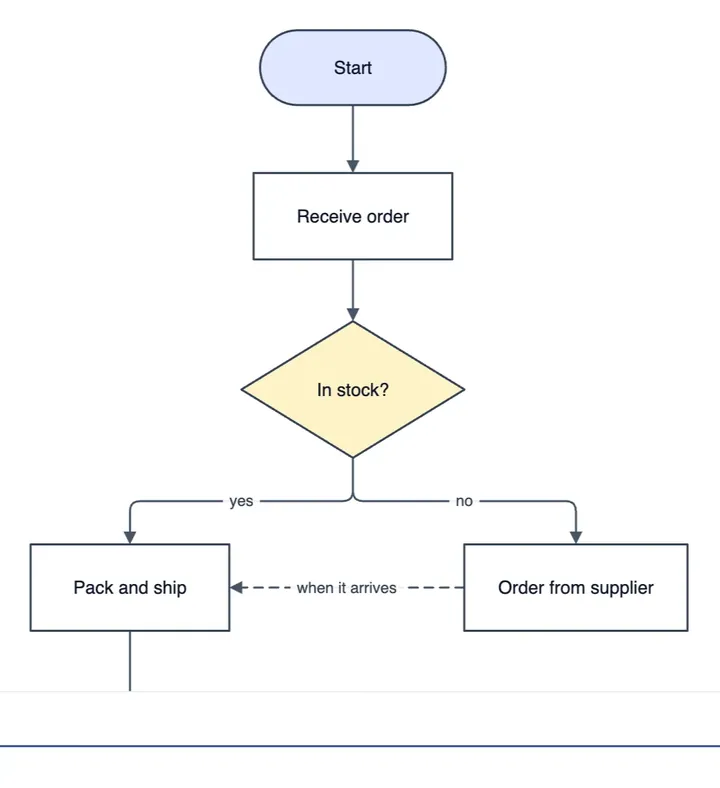
Visio Viewer
use it to open a Visio file in your browser without Visio.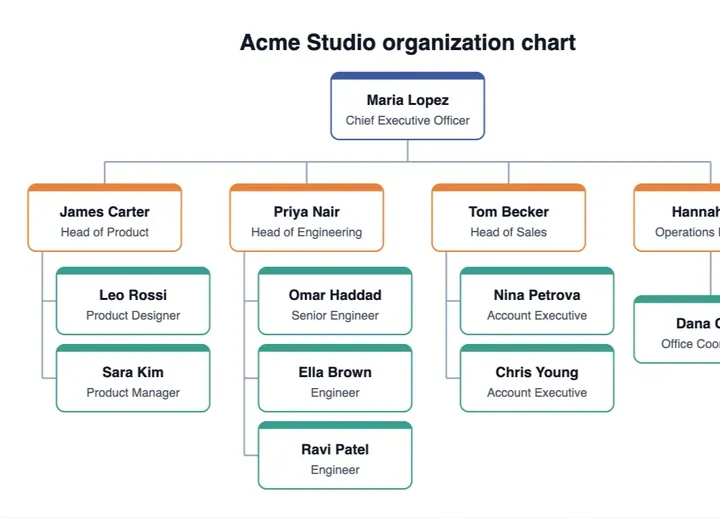
Org Chart Maker
draw or edit an org chart by hand when you do not have a spreadsheet.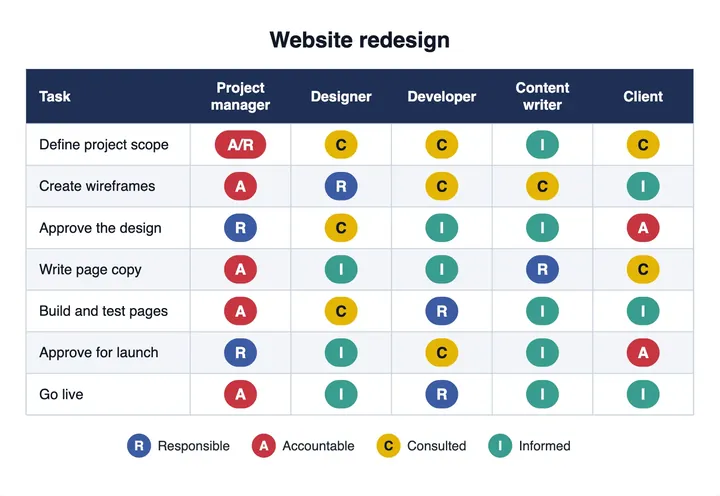
RACI Matrix Maker
assign who is responsible, accountable, consulted and informed for each task.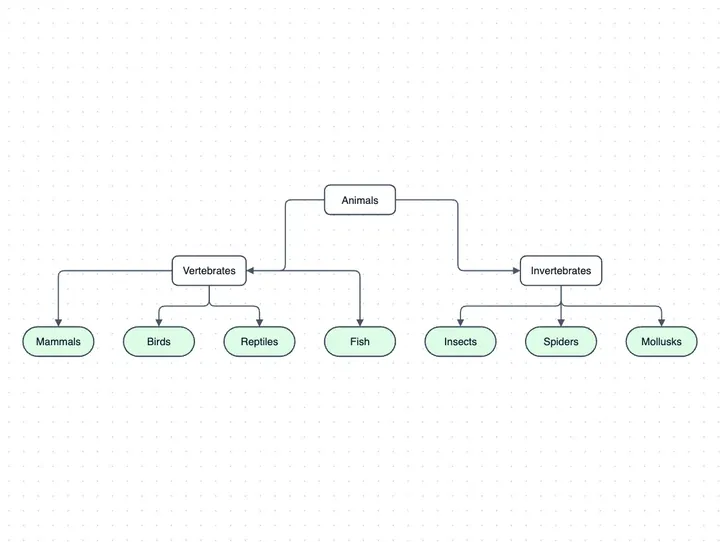
Tree Diagram Maker
show any parent-and-child hierarchy that is not a company structure.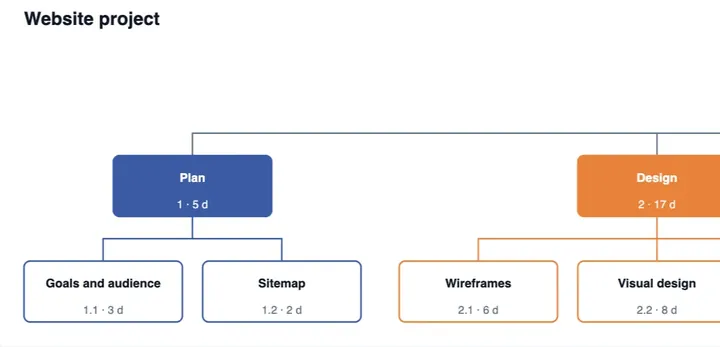
Work Breakdown Structure Template Maker
split a project into deliverables and smaller work packages.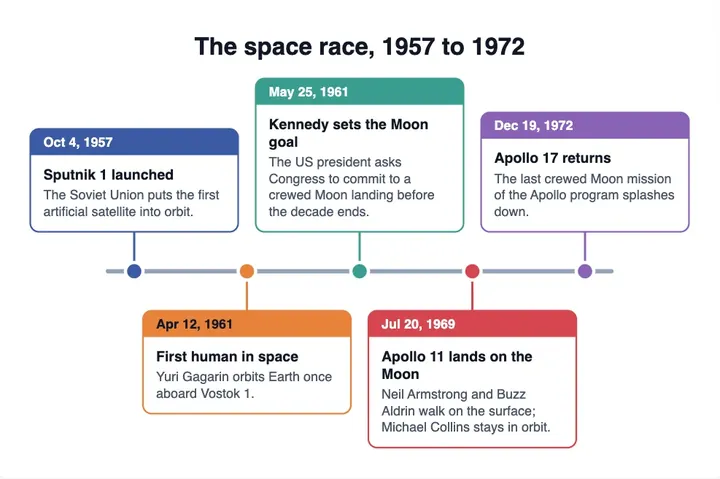
Timeline Maker
plot project phases and milestones along a line of dates.