
Fault Tree Analysis Maker
Free, no sign-up, nothing uploaded: list your events and gates and the standard fault tree draws itself in your browser; Pro adds the top-event probability and every minimal cut set.
Free · runs in your browser · nothing is uploaded
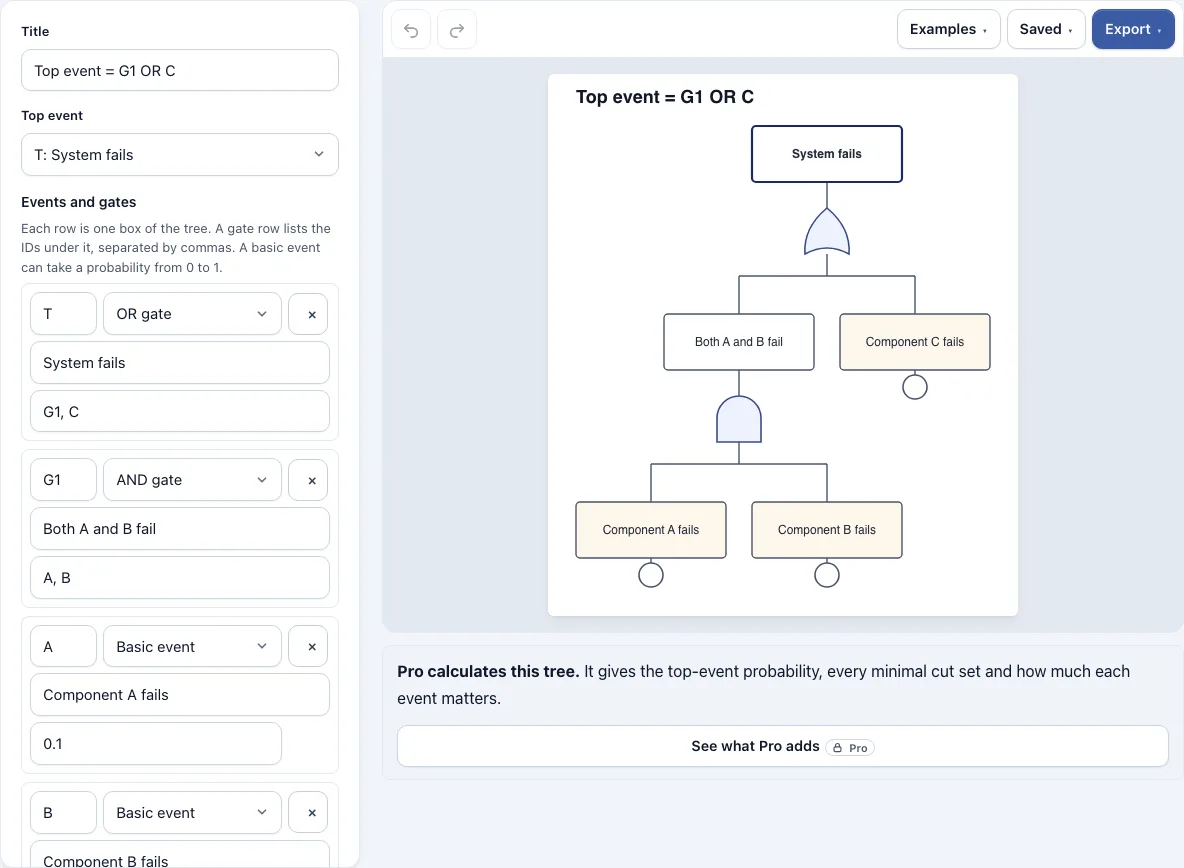
How to use the Fault Tree Analysis Maker
- Load a built-in example (AND under OR, 2-out-of-3 voting, repeated event, or pump does not deliver water), or start from the blank tree.
- Add a row for each box in the tree. Give it an ID, a kind and a label.
- For each gate, list the IDs of the rows that feed into it. A gate needs at least two inputs.
- For each basic event, enter a probability between 0 and 1. Pro uses these to calculate the top-event result.
- Pick the root in the Top event list. The tree is laid out automatically.
- Read the checks: duplicate IDs, unknown IDs, loops, gates with too few inputs, k set above the number of inputs, and rows not connected to the top.
- Export the drawing as a PNG at 1x, 2x or 4x, or as an SVG or picture PDF. Pro adds a vector PDF and a .drawio file that holds the drawing as one picture, not as editable shapes.
Your work autosaves in this browser, and the Saved menu keeps named copies of each version. A share link holds the whole document inside the link itself, so the recipient can open the same tree without an account. A tree can hold up to 80 rows.
What are the basic components of a fault tree?
A fault tree is built from the top event, intermediate events, basic events and logic gates. Each part has a job, and the tool gives each one its own kind so the drawing reads correctly.
| Part | Tool kind | Role in the tree |
|---|---|---|
| Top event | Chosen in the Top event list | The undesired outcome the analysis starts from |
| Logic gate | OR gate, AND gate, k-of-n gate | Joins inputs: an OR gate needs any one input, an AND gate needs all of them |
| Intermediate event | Output of a gate | An event that a gate produces from the events beneath it |
| Basic event | Basic event (circle) | A root cause that cannot be broken down further |
| Undeveloped event | Undeveloped event (diamond) | A cause left unexpanded because it is not analysed further |
| House event | House event (0 or 1) | A condition held permanently on or off |
Basic events are the bottom of every path. Intermediate events sit between them and the top, so a single tree can show several layers of cause.
How is the top event probability calculated in a fault tree?
With independent basic events, an AND gate multiplies its inputs, and an OR gate gives 1 minus the product of (1 minus each input). The exact method, pivotal decomposition, also handles repeated events, up to 14 of them in one tree. Probabilities below 0.0001 are shown in scientific notation, such as 1.00e-14. A tree can have up to 3,000 minimal cut sets. Above that the page says so and leaves out the cut sets, bounds and importance, because a part of the list would give wrong numbers; the exact probability is still given.
Take the tree top = (A AND B) OR C, with A at 0.1, B at 0.2 and C at 0.05. The AND gives 0.02, and the OR gives P = 1 - (1 - 0.02)(1 - 0.05) = 0.069. The minimal cut sets are {C} and {A, B}, and their rare-event sum is 0.07, a quick check on the exact answer.
Repeated events need care. Suppose two channels are lost. Channel 1 fails on shared supply A (0.1) or its controller B (0.2), and channel 2 fails on A or its controller C (0.3). Both channels are lost when A fails, or when B and C both fail:
- Exact: 0.1 + 0.9 × 0.2 × 0.3 = 0.154
- Wrong, if you multiply the channels as independent: 0.28 × 0.37 = 0.1036
The independent answer is about 0.05 too low, because A is counted in both channels as if it were two separate failures.
Frequently asked questions
What is a fault tree?
Fault tree analysis starts from one undesired event and works backward through the causes that could lead to it. The fault tree is the diagram that records those causes and how gates combine them.
How are the probabilities in a fault tree found?
Analysts usually estimate them from past data, such as how often a given cause showed up in incident records, or from test results. The tool does not estimate them for you.
What are the limitations or challenges of FTA?
FTA can be complex and needs detailed data and expert knowledge. It may miss some failure modes or common causes, and its calculations assume the events are independent.
How can I apply fault tree analysis to improve system safety?
Map every failure path from the undesired event down to its basic causes, then look for the basic events that sit on the most paths. Fix those first. Pro’s Fussell-Vesely importance gives a number for ranking them.
What is the difference between fault tree analysis and FMEA?
FMEA is bottom-up and looks at how each component can fail on its own. FTA is top-down and logic-based: it begins with one undesired event and models how combinations of failures produce it.
Can a repeated event appear under more than one gate?
Yes. An ID can be listed under several gates, and the tool draws it in each place. The exact calculation accounts for repeated events, up to 14 of them.
Does the fault tree maker upload my diagram?
No. It runs entirely in your browser, so nothing you type or open is sent to a server, and no account is needed.
Is the fault tree analysis software free?
Drawing the tree and exporting PNG, SVG and picture PDF files are free, with no watermark. Pro adds top-event probability, minimal cut sets, Fussell-Vesely importance and a CSV of the analysis. Results may be used commercially without attribution.
Related tools
Timelines, Org Charts & Business Frameworks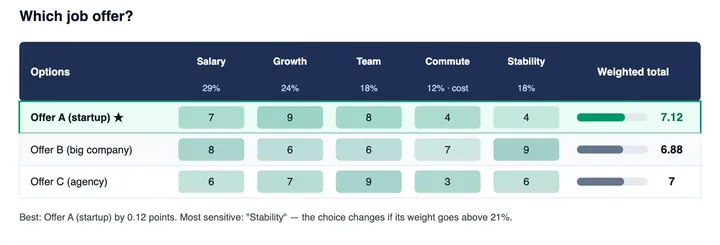
Weighted Decision Matrix
use it to score options against weighted criteria.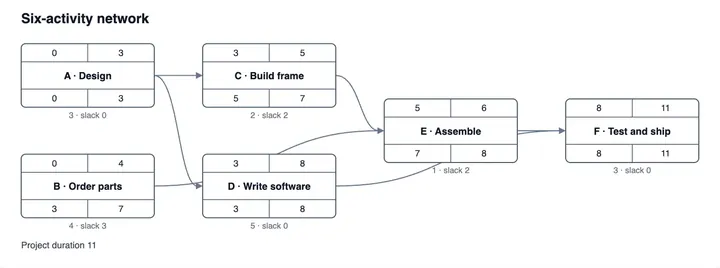
PERT Chart Maker
use it to plan project tasks and their dependencies.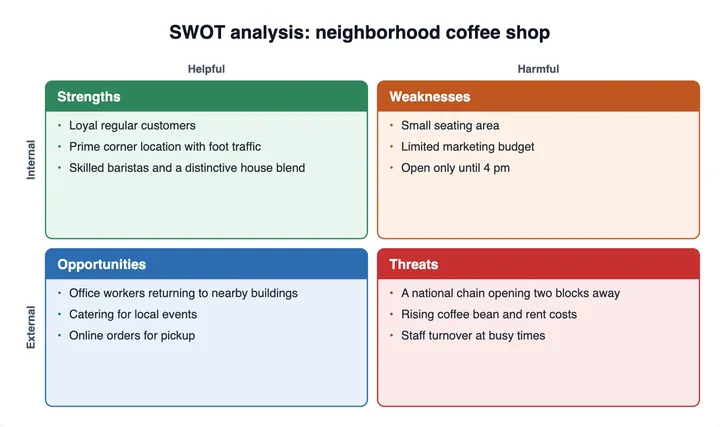
SWOT Chart Template
use it to sort strengths, weaknesses, opportunities and threats into four boxes.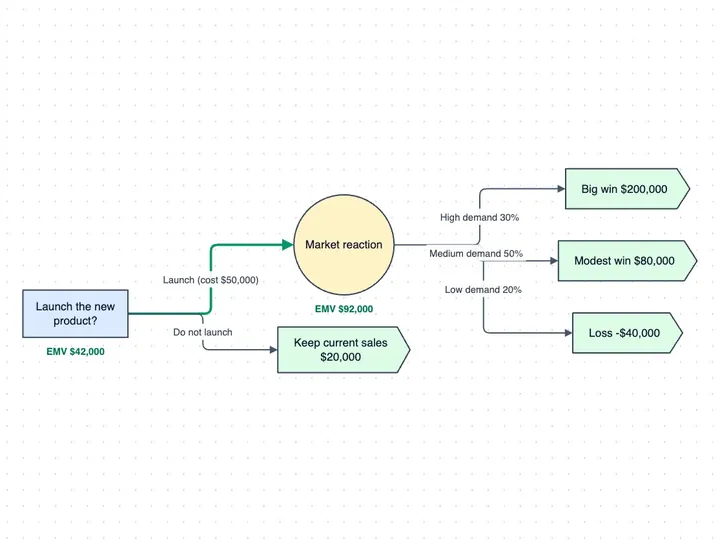
Decision Tree Maker
use it when you need to map choices and their outcomes rather than failure causes.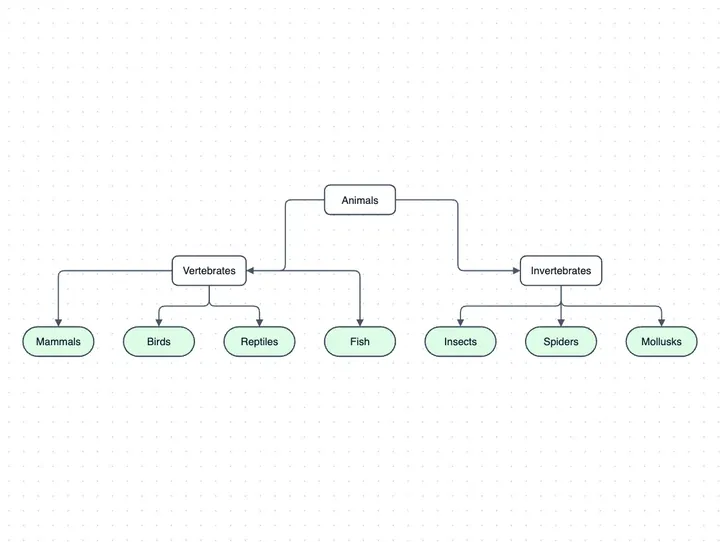
Tree Diagram Maker
use it for general hierarchical trees that don't need gates or probabilities.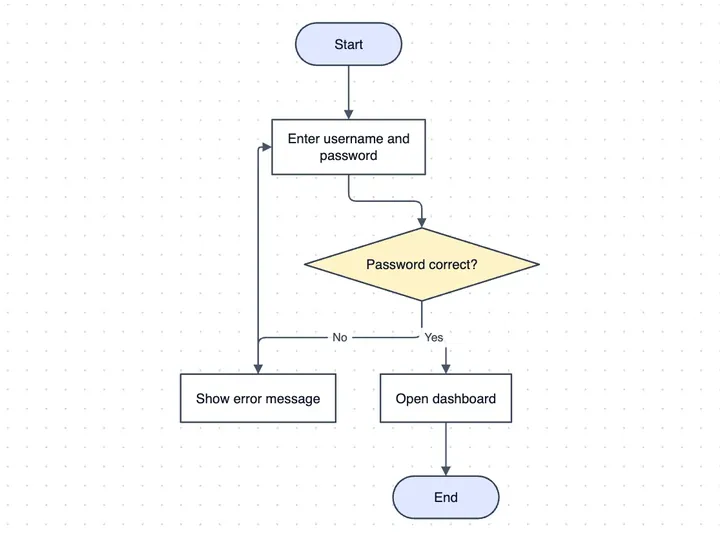
Flowchart Maker
use it to chart a process step by step.