
Code to Flowchart
Free, no sign-up, nothing uploaded: paste JavaScript, Python or pseudocode and a parser in your browser reads it, without running it, and draws every branch and loop.
Free · runs in your browser · nothing is uploaded
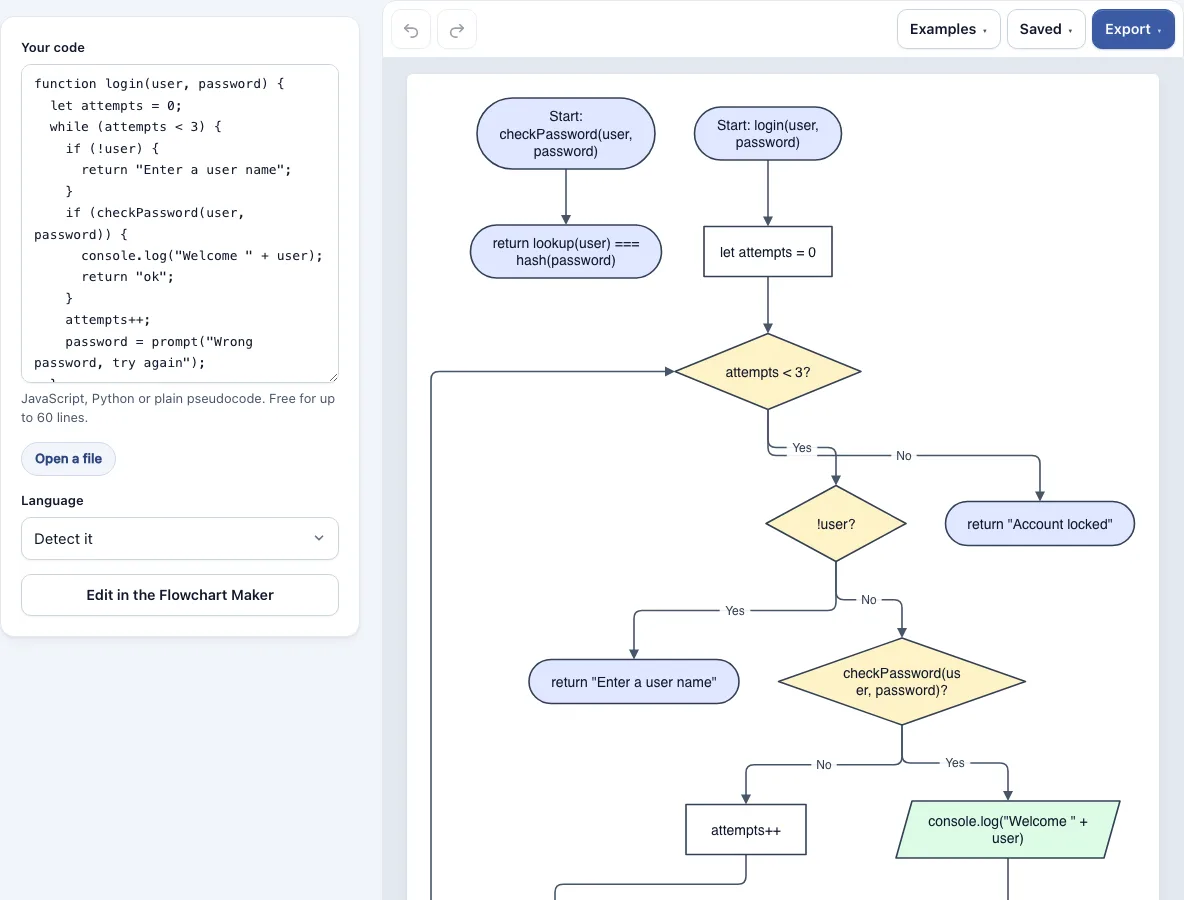
How to use the Code to Flowchart
- Paste your code or pseudocode into the input area, or open a .js, .mjs, .ts, .py or .txt file up to 2 MB.
- Check the language. The tool detects JavaScript, Python or pseudocode. If the detection is wrong, choose the language yourself.
- The free version takes up to 60 non-blank lines. Pro accepts up to 2,000, and one chart holds up to 400 shapes, so very long code stops there with a note.
- Read the chart. Diamonds are decisions, rectangles are steps, slanted boxes are input and output, and rounded shapes mark the start and end. Each function has its own start and end.
- If you see a syntax error, the message names the line. Fix that line and check the chart again.
- Click Edit in the Flowchart Maker to open the chart for changes. Editing is free.
- Export as PNG at 1x, 2x or 4x, SVG or a picture PDF. Exports carry no watermark. Pro also adds a vector PDF and an editable .drawio file.
Paste a small part of a long program first: one function at a time gives a chart that fits a page and is easier to read. Your work autosaves in this browser, and the Saved menu keeps named copies. A share link holds the whole document inside the link, so you can pass a chart to someone else without an account.
What does each flowchart shape mean?
In a code to flowchart chart, each shape stands for one kind of program step. Decisions are diamonds, which the tool uses for if, loops and switch. Ordinary steps are rectangles, input and output are slanted boxes, and rounded shapes mark where each function starts and ends.
| Shape | What it stands for | Typical source code |
|---|---|---|
| Diamond | Decision | if, while, for, switch |
| Rectangle | Step | assignments, calls and other statements |
| Slanted box | Input or output | print, read |
| Rounded | Start or end | the beginning of each function, return, the end |
What does a short Python function look like as a flowchart?
A short Python function with one if and one else becomes a start shape, a decision diamond, one output box on each branch, and an end shape where the two branches meet. Each function in a file gets its own start and end. Here is a small example:
def check(n):
    if n > 0:
        print("positive")
    else:
        print("not positive")
    return n
- A rounded start labelled Start: check(n).
- A diamond asking n > 0?
- An output box for print(“positive”) on the yes branch.
- An output box for print(“not positive”) on the no branch.
- A rounded end for return n, where both branches meet.
Why draw a flowchart from code instead of by hand?
A chart drawn from the code shows what the code does, not what someone remembers it doing. The tool follows the real branches, so a missing else or a loop that never ends is visible in the shape of the chart. Students use it to check an algorithm against the flowchart their course asks for, and developers use it to explain a function to a colleague.
The same code always gives the same chart, because a parser reads the statements. No AI writes the result, so nothing is guessed. Comments, imports and docstrings are not drawn, and the page tells you when class attributes or fields are left out. If a statement cannot be read, the page says so and names the line.
What this does not do
- It does not run your code or explain what it means. It charts the structure a parser reads.
- It does not read other languages. Java, C and the like will not produce a chart, and TypeScript works only where it uses plain JavaScript syntax.
- It does not draw comments, imports or docstrings, and the page says when class attributes or fields are left out.
- It does not take long files for free. Free is up to 60 non-blank lines; Pro takes up to 2,000, and one chart holds up to 400 shapes.
- It reports only some Python mistakes (unclosed brackets, missing colons); other mistakes may be drawn as plain steps.
Frequently asked questions
What can I paste in?
Paste JavaScript, Python or pseudocode into the input. Pseudocode can use the keywords read, print, if … then, else, end if, while, for and repeat until. Other languages are not supported, so a Java or C file will not produce a chart.
What languages does the tool support?
It reads JavaScript, parsed with the Babel parser, plus Python and plain pseudocode. The language is detected or you can choose it. TypeScript is only read where it uses plain JavaScript syntax.
Can I edit the generated flowchart?
Yes. Click Edit in the Flowchart Maker to open the chart for changes. Editing is free, and your work autosaves in this browser.
Is my code stored or shared anywhere?
No. The tool runs entirely in your browser, and nothing you type or open is uploaded to a server. A share link holds the document in the link itself. Results may be used commercially without attribution.
Does the tool run my code?
No. It follows the structure of the code and charts its logic without executing it. A JavaScript syntax error is reported with the line number so you can fix it first. In Python, unclosed brackets and missing colons are reported the same way, and other mistakes may be drawn as plain steps.
How many lines can I convert?
The free version handles up to 60 non-blank lines. Pro handles up to 2,000 non-blank lines and 400 shapes in one chart, and includes the flow check.
What does the flow check do?
The Pro flow check looks for dead ends and loose steps in the chart. These are parts of the flow that lead nowhere or connect to nothing, which often points to a gap in the logic.
What are the pseudocode keywords?
The tool recognises read, print, if … then, else, end if, while, for and repeat until. Write your steps with these words and the chart will show the decisions and loops they describe.
Related tools
Diagram Converters & File Viewers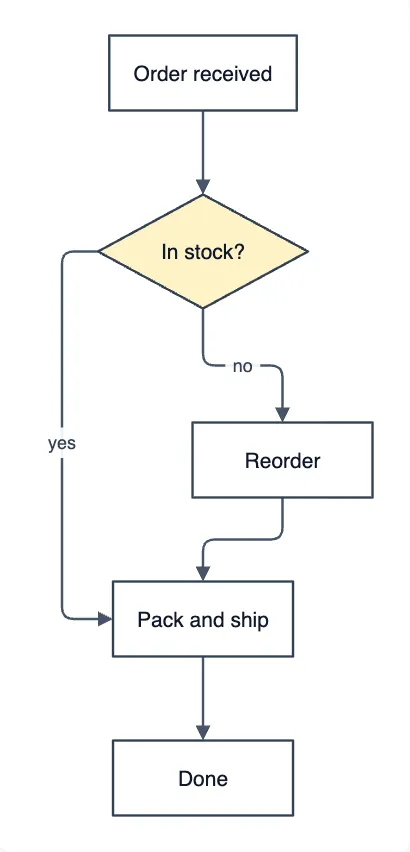
Mermaid to draw.io Converter
move a Mermaid diagram into draw.io.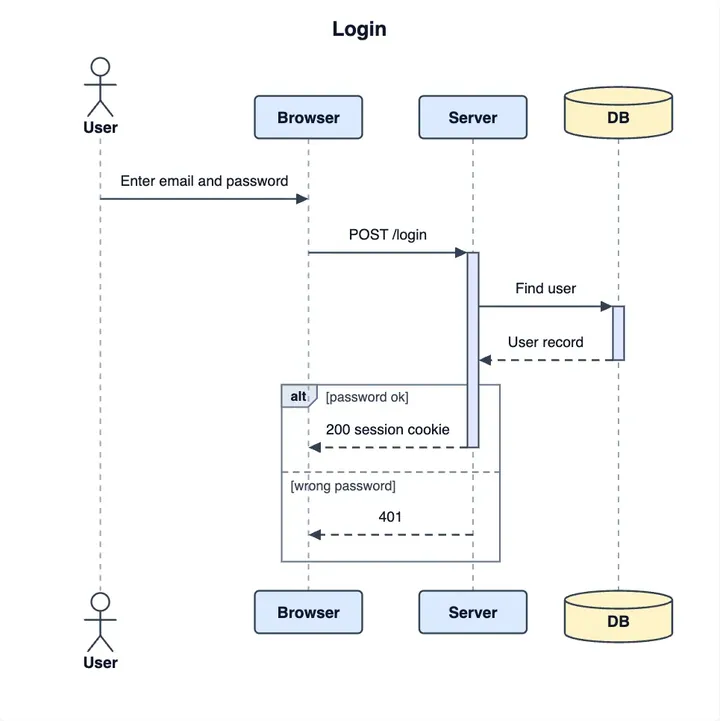
PlantUML Online Editor
write and render diagrams as text with PlantUML.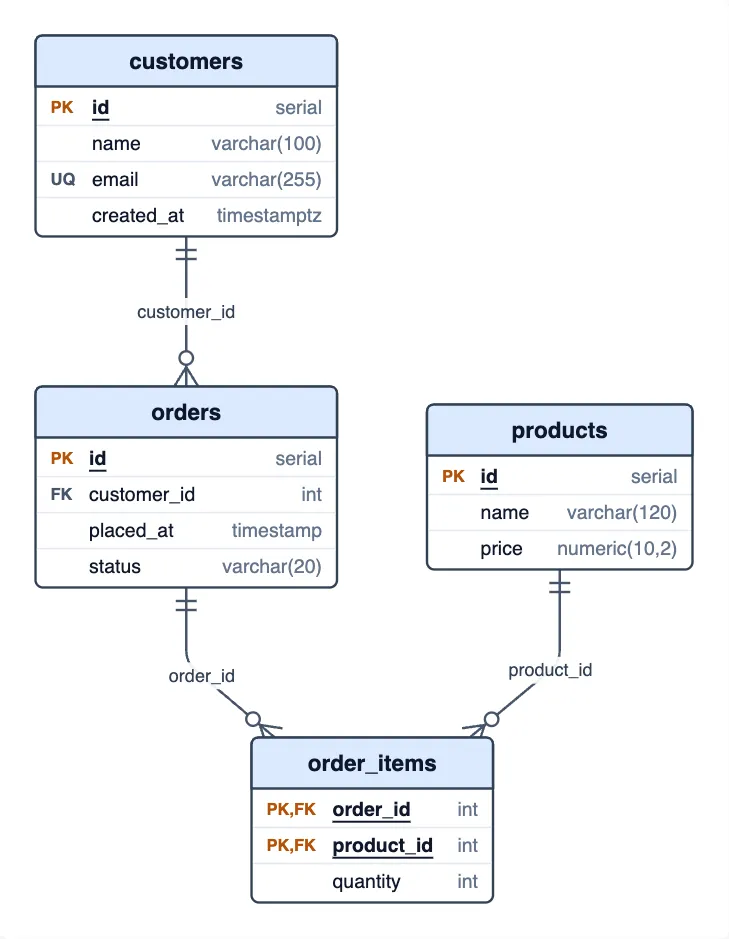
SQL to ER Diagram
use it to turn SQL table definitions into an ER diagram.
Flowchart Maker
draw or edit a flowchart by hand when you are not starting from code.
Flow Chart Template Gallery
begin from a ready layout for a common process.
Decision Tree Maker
map yes-or-no choices when the logic has no code behind it.