
Bar Graph Generator
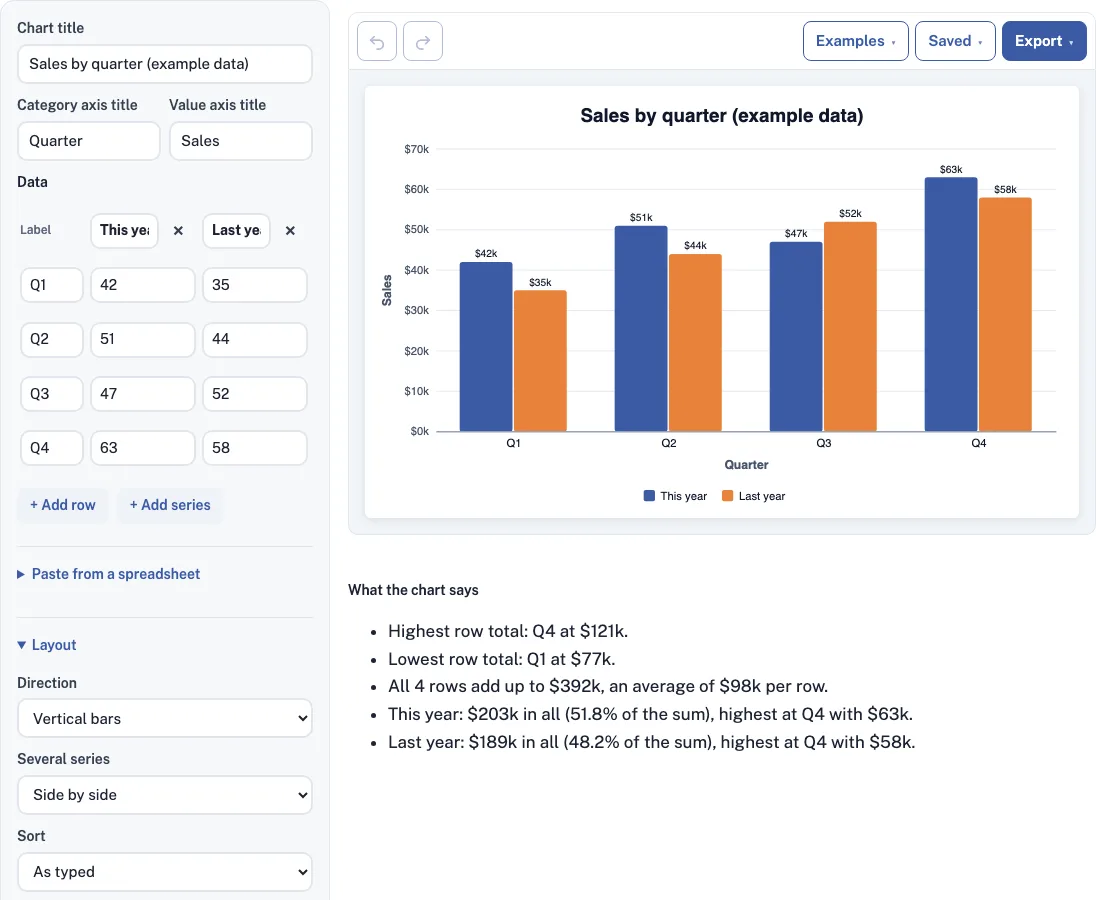
Type or paste a label and numbers for each row; the bar graph draws as you type, with a plain-words summary underneath.
Free · runs in your browser · nothing is uploaded
How to use the Bar Graph Generator
- Open Paste from a spreadsheet and paste there, or paste a block of cells straight into any cell of the data table.
- Check that the first column holds your labels and that the header row became the series names. A paste replaces the whole table.
- Edit any value in the table. Use + Add row and + Add series to grow it, and the x button to remove a row or series.
- Pick vertical or horizontal bars. A horizontal chart grows taller as you add rows.
- If you have several series, choose Side by side, Stacked or Stacked to 100%.
- Set the sort order: as typed, smallest first, or largest first (by row total).
- Pick a theme (Classic, Pastel, Dark or Grayscale), then fine-tune any series with its color picker.
- Turn the values on the bars on or off, then set the decimal places, and any text before or after the number, such as $ or k.
- Under the axis settings, type a minimum or maximum, set the tick count, turn on grid lines, or add a dashed red reference line with a label.
- Download the chart as a PNG, SVG or PDF from the Export menu, or copy a link from the Saved menu.
The Examples menu loads five starting points: two series side by side, survey answers sorted, a stacked budget, a stacked to 100% chart, and negatives with a target line. The layout controls include a space-between-bars slider and small, medium and large chart sizes.
Bar graph vs bar chart vs histogram: what is the difference?
Bar graph and bar chart are two names for the same thing: rectangles whose lengths show values for separate categories. A histogram is different. It groups numbers into ranges, and its bars touch because the ranges run into each other. The table below shows how to tell them apart.
| Chart | Data it shows | Bars | Typical question |
|---|---|---|---|
| Bar graph or bar chart | One value per category | Separated by gaps | Which category is biggest? |
| Histogram | Counts of values within ranges | Touch each other | How are values spread out? |
This tool draws bar graphs and bar charts, so each row needs a label in the first column.
How do I make a bar graph from Excel or Google Sheets data?
Copy the cells, including the header row and the label column, from Excel or Google Sheets, then paste them into the Paste from a spreadsheet box. The header row becomes your series names, and numbers formatted as $12, 12% or (12) are read correctly. The steps below cover the full process.
- In your sheet, select the label column and the value columns, with the header row at the top.
- Copy the selection with Ctrl+C (Cmd+C on a Mac).
- Paste into the Paste from a spreadsheet box, or paste into any cell of the data table.
- Check the table: the first column should hold your labels, and each heading should be a series name.
- Look over the chart and correct any cell that reads wrongly.
The table holds up to 6 number series and 60 rows. If you paste again later, the new paste replaces the old table, so keep your original sheet as a backup.
What is a bar graph?
A bar graph shows one value per category as a rectangle, so a longer bar means a bigger value. Readers compare the ends of the bars against a shared baseline, which is why it is the plainest way to rank categories or compare groups. Bar chart is another name for the same picture.
When should bars be stacked or side by side?
Use side by side to compare each series within every category, such as this year against last year for each quarter. Use Stacked when the parts add up to a meaningful total, like budget lines; the row total then appears on top. Use Stacked to 100% to compare each part’s share of its row.
How do I read the summary under the chart?
The “What the chart says” box puts the chart into words, which helps when you paste it into a report. Take This year 42, 51, 47, 63 and Last year 35, 44, 52, 58 by quarter. The summary reports:
- Highest row total: Q4 at 121. Lowest: Q1 at 77.
- All 4 rows add up to 392, an average of 98 per row.
- This year: 203 in all (51.8% of the sum), highest at Q4 with 63.
- Last year: 189 in all (48.2% of the sum), highest at Q4 with 58.
With a reference line it also counts how many rows reach it.
Frequently asked questions
Should a bar graph start at zero?
By default the axis starts at zero, which keeps the bar lengths honest. You can type your own minimum and maximum, but a bar that starts above zero can make small differences look large. If a limit you type cuts off a bar, the tool shows a warning.
How do negative numbers work?
In a stacked chart, positive values pile up from zero and negative values pile down below it. In a 100% chart, each bar shows a value’s share of the row’s sum of absolute values. The Examples menu includes a negatives example with a target line you can start from.
Can I change the colors?
Yes. You can choose one of four themes (Classic, Pastel, Dark or Grayscale), use the color picker of each series, or, for a single series, pick “A different color for each bar.”
Can I edit the data after pasting?
Yes. Pasted data stays in an editable table where you can change any cell, add rows with + Add row or series with + Add series, and remove them with the x buttons. Series names are edited in the column heading.
Can I download the bar graph once it’s created?
Yes. PNG (also 2x and 4x), SVG and PDF downloads are free with no watermark. Pro adds a vector PDF and an editable .drawio file that opens in diagrams.net, where every bar is a real rectangle you can restyle.
Related tools
Charts & Graphs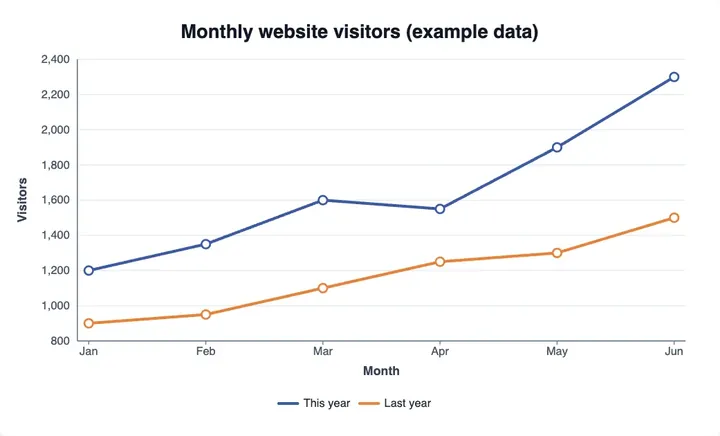
Line Graph Generator
use it when the values change over time.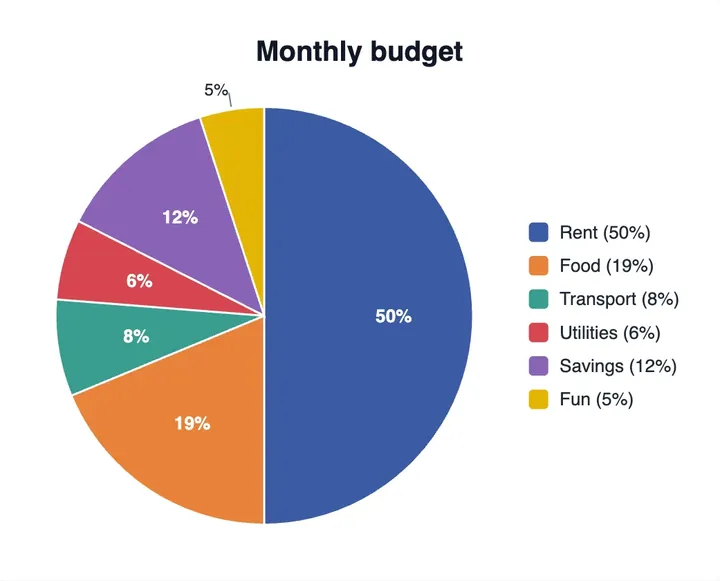
Pie Chart Maker
use it to show parts of one whole.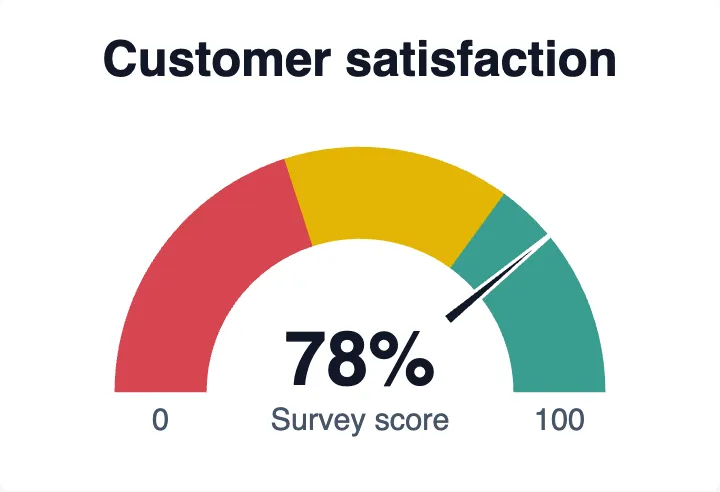
Gauge Chart Maker
use it for a single value against a range.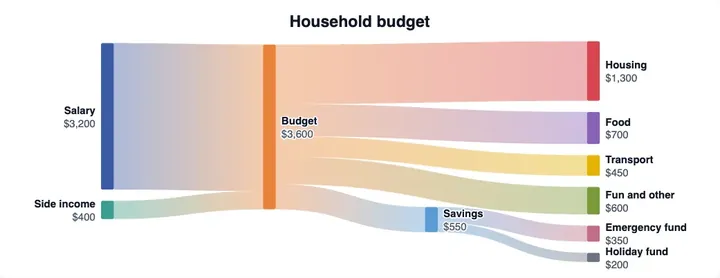
Sankey Diagram Generator
use it to show how quantities flow between stages.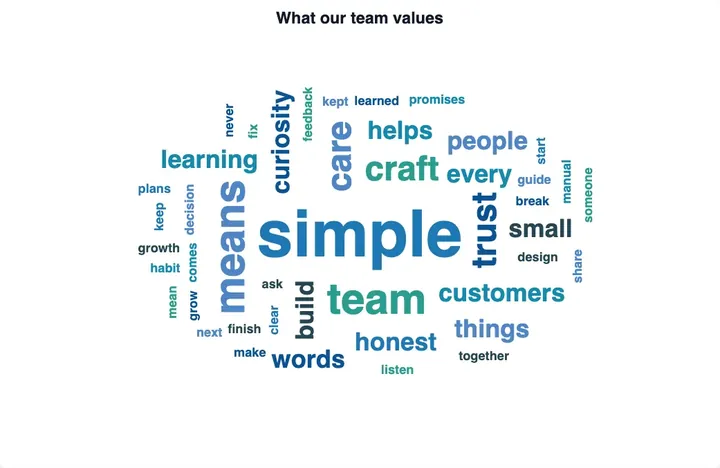
Word Cloud Generator
use it when your data is words, not numbers.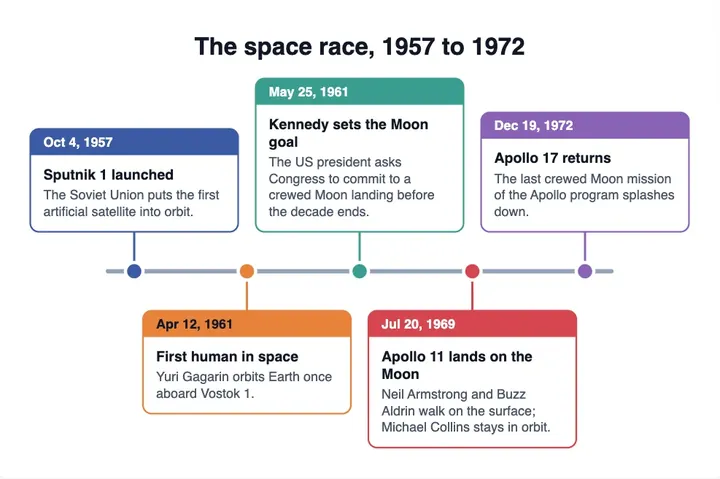
Timeline Maker
use it to place events along a line of dates.